Page 53 - MIC 2014 - English
P. 53
Annual Incentive. Mr. MacSween’s AIP award for 2013 was $540,000. The award is 141% of his target award level of
$382,500, which is 75% of his base salary. The range for the AIP award is from 0% to a maximum of 220% of the
target award level. The Corporate and Business Unit performance factors used in determining Mr. MacSween’s AIP award
are as approved by the HR&CC and as set forth in the table on page 40. The Personal performance factor is determined
based on the assessment of Mr. MacSween’s performance by the President and CEO, for which Mr. MacSween received a
performance rating that translates to the performance factor displayed below. Mr. MacSween’s actual award recognizes
his strong performance in 2013. The calculation of Mr. MacSween’s AIP award amount is comprised of two steps as
displayed below.
1. AIP Performance Factor Calculation
Overall
Performance
Corporate Performance Business Unit (BU) Performance Personal Performance Factor
Weight Performance Total Wtd. Performance Total Major Performance Total Weight Performance Total Total
Factor [A] Avg. of Factor [B] Projects BU Factor [C] Factor [D] [A+B+C+D]
all BUs Performance
20% 1.43 0.29 30% 1.33 0.40 30% 1.40 0.42 20% 1.50 0.30 1.41
2. AIP Payout Calculation
Base Salary AIP Target Performance Factor for Payout(1) Payout Calculation Actual Award
[A]
[B]
[C]
[ABC]
$540 000
$510 000
75%
1.41
$539 325
(1) Rounded to two decimal places. Due to rounding, actual calculations may result in small differences from the payout calculation shown.
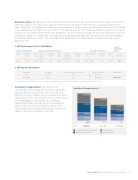
Total Direct Compensation. For reference, the
Total Direct Compensation ($)
corresponding chart displays Mr. MacSween’s total direct
compensation for the past three years. The mid- and
long-term incentive amounts are the deemed value of the 1,172,000
equity grants (at the date of grant, and as calculated using
933,660
the methodology described under the ‘‘Summary
Compensation Table’’ on page 58 of this management
1,233,480
proxy circular) and will differ from the ultimate value 934,127
612,414
realized from the awards based on Suncor’s relative and
absolute share price performance over time.
611,969
540,000
485,000
400,000
503,942
474,673
384,077
2013
2012
2011
Total 3,449,422
2,827,460
2,008,460
Long-Term Incentive (stock options)
Annual Incentive
Mid-Term Incentive (PSUs)
Base salary (actual)
26FEB201421265078
SUNCOR ENERGY INC. MANAGEMENT PROXY CIRCULAR 2014 51