Page 42 - MIC 2014 - English
P. 42
EXECUTIVE COMPENSATION
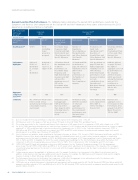
Annual Incentive Plan Performance. The following table summarizes the overall 2013 performance results for the
Corporate and Business Unit components of the Suncor AIP and the Performance Area scores achieved versus the 2013
opportunity, including performance highlights.
AIP Component
(AIP Target Corporate Business Unit(2)
(20%)
(60%)
Weight)(1)
Overall Score(3) 133
143(4)
Performance CFOPS(6)
ROCE(6)
Personal and Environment
Reliability
People
(5)
AreaProcess Safety
(‘‘P&PS’’)
Key Measures(7)
CFOPS
ROCE Recordable Injury Production, Oil Voluntary Attrition, Number of
(excluding Frequency, High Sands Cash Quality of Regulatory
major Potential and High Operating Costs(6), Development Plans Non-Compliances,
projects in Risk Incidents and Execution of in Place and Other Energy Intensity
progress)
Other Business Unit Growth Plans and Business Unit and Other Business
Specific Measures
Other Business Unit Specific Measures
Unit Specific
Specific Measures
Measures
Performance Achieved Achieved a Oil Sands achieved OSV (as defined on R&M (as defined
Oil Sands and E&P
Highlights
CFOPS of ROCE of the maximum score page 37) had the on page 37) had (as defined on
$9.5 billion 12.2% vs. a of 200 for highest aggregate the highest page 37) achieved
vs. a target target of 9%
performance on reliability score at aggregate score led maximum scores of
of
Recordable Injury 164 reflecting by performance vs. 200 for their
$8.9 billion
Frequency and better than target the voluntary respective
High Risk Incidents
performance on all
attrition measure,
performance on
measures and E&P measures including which was lowest the Number of
achieved the net cash among the business Regulatory
maximum score of contribution from units at 1.5%, Non-Compliances
200 on the Syncrude and
resulting in a measure
Recordable Injury New Asset Start-up maximum score of
Frequency measure
(Hot Bitumen 200 for this
Terminal)
measure
Aggregate
131
155
151
121
148
Component 141
Score(3)(8)(9)
All business units Other Business Unit Business unit Comments
The CFOPS and ROCE results All business units,
had aggregate scores ranged from aggregate scores reflect overall strong with the exception
P&PS performance 88 for E&P to
for measures in this operational performance and of OSV, had
that was better 158 for the Major Performance Area a favourable business aggregate
than target in 2013 Projects Unit
ranged from 67 for environment
performance for
reflecting Suncor’s Major Projects to the environment
strong focus on 180 for R&M
performance area
safety
that was better
than target
(1) Does not include the Personal performance component, which represents the remaining 20% of the AIP.
(2) 2013 business units for the purpose of AIP are as follows: Oil Sands; In Situ; E&P; R&M; OSV; and Major Projects.
(3) The scoring opportunity for the Corporate and Business Unit component of AIP ranges from 0 to a maximum of 200, with a target score of 100.
(4) For 2013, CFOPS (previously defined herein as ‘‘cash flow from operations’’) of $11.0 billion and ROCE (previously defined herein as ‘‘return on capital
employed’’) of 14% would have had to have been achieved for a maximum score of 200% for the Corporate measures component; CFOPS of
$6.6 billion and ROCE of 5% would result in no payout; and CFOPS and ROCE results between the minimum and maximum target levels would
provide payouts on a sliding scale of between 0% and 200%.
(5) Suncor’s business unit guideline target weightings by Performance Area are as follows: 15% for each of P&PS, Environment and People; and 55% for
Reliability. However, these target weightings may vary slightly for individual business units, in order to place increased emphasis on a particular
performance area for that year. For example, in 2013, the R&M business unit assigned a 15% target weighting to each of Environment and People,
20% to P&PS, and 50% to Reliability. For 2013, the overall company target weightings for the four Performance Areas within the Business Unit
component of AIP in the foregoing table were as follows: 16% for P&PS; 15% for Environment; 54% for Reliability; and 15% for People.
(6) CFOPS, ROCE and Oil Sands cash operating costs are non-GAAP measures. See the ‘‘Advisories’’ beginning on page 74 of this management
proxy circular. The AIP CFOPS of $9.5 billion and ROCE of 12.2% results reflect adjustments for the disposition of the majority of the company’s
conventional natural gas business, the decision to not proceed with the Voyageur upgrader project and the impact on production in Libya due to
political unrest.
(7) Certain measures may not be applicable to all business units. For example, Production is not a measure for the Major Projects business unit. In
addition, certain business units may have additional unit specific measures. For example, the R&M business unit measures include specific reliability
measures focusing on Retail, Wholesale, Distribution and Lubricants operations.
(8) The Performance Area scores for the Business Unit component of AIP reflect the aggregate scores achieved across all of the business units.
Performance for individual business units will vary from the aggregate scores.
(9) CFOPS also acts as a threshold measure for determining if any payments will be made under the AIP. The AIP threshold CFOPS level below which AIP
payments would be reduced to 50% was $6.6 billion for 2013. The AIP threshold CFOPS level below which no payment would be made under the AIP
was $3.3 billion for 2013.
40 SUNCOR ENERGY INC. MANAGEMENT PROXY CIRCULAR 2014