Page 20 - MIC 2014 - English
P. 20
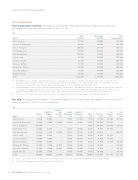
BOARD OF DIRECTORS COMPENSATION


Total Compensation

Total Compensation Summary. The following table provides information on the total compensation paid to the

non-employee directors for the year ended December 31, 2013.


($)
Total
Share-Based Total
Name(1) Fees Paid
Awards(2)
Compensation(3)

Mel E. Benson 87 000
188 499
275 499
.......................................................................................................................................................................................................................................................
Dominic D’Alessandro 100 500 188 499 288 999
.......................................................................................................................................................................................................................................................

John T. Ferguson 256 000 290 574 546 574
.......................................................................................................................................................................................................................................................
W. Douglas Ford 91 500 188 499 279 999
.......................................................................................................................................................................................................................................................
Paul Haseldonckx 102 000 188 499 290 499
.......................................................................................................................................................................................................................................................
John R. Huff 91 500 188 499 279 999
.......................................................................................................................................................................................................................................................
Jacques Lamarre 92 500 188 499 280 999
.......................................................................................................................................................................................................................................................

Maureen McCaw 91 500 188 499 279 999
.......................................................................................................................................................................................................................................................
Michael W. O’Brien 110 000 188 499 298 499
.......................................................................................................................................................................................................................................................
James W. Simpson 97 000 188 499 285 499
.......................................................................................................................................................................................................................................................
Eira M. Thomas 95 500 188 499 283 999

Total 1 215 000 2 175 564 3 390 564

(1) Mr. Williams, Suncor’s President and CEO, did not receive compensation for serving as a member of the Board. Please refer to page 58 of this
management proxy circular for specifics of the compensation provided to Mr. Williams for the year ended December 31, 2013. Messrs. Gass and
Wilson are not represented in the foregoing table as they were appointed to the Board effective February 3, 2014.

(2) Share-based awards consist of DSUs, which are granted annually and awarded in equal quarterly installments. Grant date fair market value is based on
the average of the day’s high and low price of a Suncor common share on the TSX for the trading day immediately preceding the date of each
quarterly award ($30.48, $31.14, $37.27, $37.21). DSUs cannot be redeemed by non-employee directors until they cease to hold office.
(3) Suncor does not provide stock options, pension benefits, non-equity incentives or other compensation to non-employee directors.


Fees Paid. The following table provides a detailed breakdown of the fees paid to our non-employee directors for the year

ended December 31, 2013. Fees are paid quarterly.


($)
Committee
Committee Chair Board Committee
Fees Fees
Retainer Retainer Retainer Attendance Attendance Travel Total Fees Taken in Taken in

Name(1)
Fee Fee
Fee Fee Fee
Fees Paid(2)
DSUs
Cash
43500
43500
Mel E. Benson
50000 10000
— 10500 15000
1500 87000
.......................................................................................................................................................................................................................................................
Dominic D’Alessandro 50 000 6 000 10 000 10 500 18 000 6 000 100 500 100 500 —
.......................................................................................................................................................................................................................................................
John T. Ferguson 250000 — — — — 6000 256000 128000 128000
.......................................................................................................................................................................................................................................................
W. Douglas Ford 50000 10000 — 10500 15000 6000 91500 91500 —
.......................................................................................................................................................................................................................................................
Paul Haseldonckx 50 000 6 000 10 000 10 500 16 500 9 000 102 000 — 102 000
.......................................................................................................................................................................................................................................................
John R. Huff 50000 10000 — 10500 15000 6000 91500 91500 —
.......................................................................................................................................................................................................................................................
Jacques Lamarre 50 000 11 000 — 10 500 16 500 4 500 92 500 92 500 —
.......................................................................................................................................................................................................................................................
Maureen McCaw 50 000 10 000 — 10 500 15 000 6 000 91 500 45 750 45 750
.......................................................................................................................................................................................................................................................
Michael W. O’Brien 50000 5000 25000 10500 18000 1500 110000 — 110000
.......................................................................................................................................................................................................................................................
James W. Simpson 50000 5000 15000 10500 15000 1500 97000 — 97000
.......................................................................................................................................................................................................................................................
Eira M. Thomas 50000 11000 — 10500 18000 6000 95500 — 95500

Total 750 000 84 000 60 000 105 000 162 000 54 000 1 215 000 593 250 621 750

(1) Messrs. Gass and Wilson are not represented in the foregoing table as they were appointed to the Board effective February 3, 2014.

(2) Amounts reflect aggregate value of fees paid in cash and/or DSUs.


18 SUNCOR ENERGY INC. MANAGEMENT PROXY CIRCULAR 2014