Page 81 - Suncor AR English
P. 81
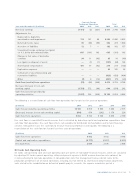
Corporate, Energy

Trading and Eliminations
Total
Year ended December 31 ($ millions) 2013 2012 2011 2013 2012 2011
Net (loss) earnings (1 151) (3) (331)
3 911 2 740 4 304
.......................................................................................................................................................................................................................................................
Adjustments for:
.......................................................................................................................................................................................................................................................
Depreciation, depletion,

amortization and impairment 119 161 99 4 892 6 446 3 952
.......................................................................................................................................................................................................................................................
Deferred income taxes 90 (94) (99) 382 729 1 644
.......................................................................................................................................................................................................................................................
Accretion of liabilities 12 7 — 192 182 157
.......................................................................................................................................................................................................................................................
Unrealized foreign exchange loss (gain)
on U.S. dollar denominated debt 605 (181) 183 605 (181) 183
.......................................................................................................................................................................................................................................................
Change in fair value of derivative

contracts 94 11 (43) 95 10 (40)
.......................................................................................................................................................................................................................................................

Loss (gain) on disposal of assets — (1) (1) (137) (44) 136 .......................................................................................................................................................................................................................................................

Share-based compensation 160 57 (42) 214 214 (102) .......................................................................................................................................................................................................................................................

Exploration expenses — — — 82 145 28 .......................................................................................................................................................................................................................................................

Settlement of decommissioning and
restoration liabilities — — — (423) (433) (496)
.......................................................................................................................................................................................................................................................
Other (7) 4 (12) (401) (75) (20)

Cash flow (used in) from operations (78) (39) (246) 9 412 9 733 9 746
.......................................................................................................................................................................................................................................................
Decrease (increase) in non-cash
working capital (1 759) 572 (80) 688 (874)
242

Cash flow (used in) provided by
operating activities (1 837) 533 (326) 10 100 8 859
9 988


The following is a reconciliation of cash flow from operations for Suncor’s last five years of operations.


($ millions) 2013 2012 2011 2010 2009

Cash flow provided by operating activities 10 100 8 859 9 988 5 486
2 575
.......................................................................................................................................................................................................................................................

(Decrease) increase in non-cash working capital (688) 874 (242) 1 170 224
Cash flow from operations 9 412 9 733 9 746 6 656 2 799


Free cash flow is a non-GAAP financial measure that is calculated by deducting capital and exploration expenditures from
cash flow from operations. Free cash flow reflects cash available for distribution to shareholders and to fund financing

activities. Management uses free cash flow to measure financial performance and liquidity. The following is a
reconciliation of free cash flow for Suncor’s last three years of operations.


($ millions) 2013 2012 2011

Cash flow from operations 9 412 9 733 9 746
.......................................................................................................................................................................................................................................................
Capital and exploration expenditures (6 777) (6 957) (6 850)

Free Cash Flow 2 635 2 776 2 896


Oil Sands Cash Operating Costs

Oil Sands cash operating costs and cash operating costs per barrel are non-GAAP financial measures, which are calculated
by adjusting Oil Sands segment operating, selling and general expense (a GAAP measure based on sales volumes) for

i) costs pertaining to Syncrude operations; ii) non-production costs that management believes do not relate to the
production performance of Oil Sands Operations, including, but not limited to, share-based compensation adjustments,

costs related to the remobilization or deferral of growth projects, research, the expense recorded as part of a


SUNCOR ENERGY INC. ANNUAL REPORT 2013 77