Page 77 - Suncor AR English
P. 77
12. ADVISORIES
Non-GAAP Financial Measures
Certain financial measures in this MD&A – namely operating earnings, ROCE, cash flow from operations, free cash flow,
Oil Sands cash operating costs and LIFO – are not prescribed by GAAP. These non-GAAP financial measures are included
because management uses the information to analyze operating performance, leverage and liquidity. These non-GAAP
financial measures do not have any standardized meaning and, therefore, are unlikely to be comparable to similar
measures presented by other companies. Therefore, these non-GAAP financial measures should not be considered in
isolation or as a substitute for measures of performance prepared in accordance with GAAP. Except as otherwise
indicated, these non-GAAP measures are calculated and disclosed on a consistent basis from period to period. Specific
adjusting items may only be relevant in certain periods.
Effective January 1, 2013, Suncor adopted new and amended accounting standards; as such, non-GAAP measures for
2012 have been restated while comparative figures pertaining to Suncor’s results prior to and including 2011 have not
been restated in accordance with the respective transitional provisions of the new and amended standards.
Non-GAAP measures for 2009 are reported under a previous GAAP.
Operating Earnings
Operating earnings is a non-GAAP financial measure that adjusts net earnings for significant items that are not indicative
of operating performance. Management uses operating earnings to evaluate operating performance, because
management believes it provides better comparability between periods. Operating earnings are reconciled to net earnings
in the Financial Information section of the MD&A.
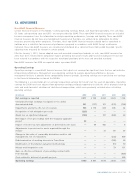
The following is a reconciliation of net earnings to operating earnings for Suncor’s last five years of operations. Operating
earnings for 2009 have been adjusted from operating earnings previously reported to include the effect of project start-up
costs and mark-to-market valuations of stock-based compensation, which were previously excluded when calculating
operating earnings.
($ millions) 2013 2012 2011 2010 2009
Net earnings as reported 3 911 2 740 4 304 3 829 1 146
.......................................................................................................................................................................................................................................................
Unrealized foreign exchange loss (gain) on U.S. dollar
denominated debt 521 (157) 161 (372) (798)
.......................................................................................................................................................................................................................................................
Impairments and write-offs, net of reversals 563 2 176 629 306 42
.......................................................................................................................................................................................................................................................
Recognition of risk mitigation proceeds (223) — — — —
.......................................................................................................................................................................................................................................................
(Gain) loss on significant disposals (130) — 107 (826) 39
.......................................................................................................................................................................................................................................................
Net impact of not proceedings with the Voyageur upgrader
project 58 — — — —
.......................................................................................................................................................................................................................................................
Impact of income tax rate adjustment on deferred income taxes — 88 442 — 4
.......................................................................................................................................................................................................................................................
Adjustments to provisions for assets acquired through the
merger — — 31 68 97
.......................................................................................................................................................................................................................................................
Change in fair value of commodity derivatives used for risk
management, net of realizations — — — (233) 499
.......................................................................................................................................................................................................................................................
Redetermination of working interests in Terra Nova — — — (166) 24
.......................................................................................................................................................................................................................................................
Modification of the bitumen valuation methodology — — — (51) 50
.......................................................................................................................................................................................................................................................
Merger and integration costs — — — 79 151
.......................................................................................................................................................................................................................................................
Gain on effective settlement of pre-existing contract with
Petro-Canada — — — — (438)
.......................................................................................................................................................................................................................................................
Costs related to deferral of growth projects — — — — 299
Operating earnings 4 700 4 847 5 674 2 634 1 115
SUNCOR ENERGY INC. ANNUAL REPORT 2013 73