Page 64 - Suncor AR English
P. 64
FINANCIAL CONDITION AND LIQUIDITY
individual transactions. For the year ended December 31, December 31, 2013, the pre-tax earnings impact for
2013, the pre-tax earnings impact for risk management Energy Trading activities was a gain of $176 million (2012 –
activities was a loss of $18 million (2012 – pre-tax gain of pre-tax gain of $246 million).
$1 million).
Gains or losses related to derivatives are recorded as Other
The company’s Energy Trading business uses crude oil, Income in the Consolidated Statements of Comprehensive
natural gas, refined products and other derivative contracts Income.
to generate net earnings. For the year ended
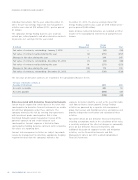
Risk Energy
($ millions)
Management
Trading Total
Fair value of contracts, outstanding – January 1, 2012
—
(34) (34)
.......................................................................................................................................................................................................................................................
Fair value of contracts realized during the year (2) (255) (257)
.......................................................................................................................................................................................................................................................
Changes in fair value during the year 1 246 247
Fair value of contracts, outstanding – December 31, 2012 (1) (43) (44)
.......................................................................................................................................................................................................................................................
Fair value of contracts realized during the year 18 (271) (253)
.......................................................................................................................................................................................................................................................
Changes in fair value during the year (18) 176 158
Fair value of contracts, outstanding – December 31, 2013 (1) (138) (139)
The fair value of derivative contracts are recorded in the Consolidated Balance Sheets.
Fair value of derivative contracts at
December 31 ($ millions)
2013 2012
225 53 Accounts receivable
.......................................................................................................................................................................................................................................................
Accounts payable
(364) (97)
(139) (44)
Risks Associated with Derivative Financial Instruments
exposure to market volatility, as well as the need for stable
Suncor may be exposed to certain losses in the event that cash flow to finance future growth. Energy Trading
counterparties to derivative financial instruments are unable activities are governed by a separate risk management
to fulfil their obligations under these contracts. The group that reviews and monitors practices and policies and
company minimizes this risk by entering into agreements provides independent verification and valuation of these
with investment grade counterparties. Risk is also activities.
minimized through regular management review of the
For further details on our derivative financial instruments,
potential exposure to and credit ratings of such including assumptions made in the calculation of fair value,
counterparties. Suncor’s exposure is limited to those
a sensitivity analysis of the effect of changes in commodity
counterparties holding derivative contracts with net positive prices on our derivative financial instruments, and
fair values at a reporting date.
additional discussion of exposure to risks and mitigation
Suncor’s risk management activities are subject to periodic activities, see the Financial Instruments and Risk
reviews by management to determine appropriate hedging Management note in our 2013 audited Consolidated
requirements based on the company’s tolerance for
Financial Statements.
60 SUNCOR ENERGY INC. ANNUAL REPORT 2013