Page 60 - Suncor AR English
P. 60
FINANCIAL CONDITION AND LIQUIDITY
8. FINANCIAL CONDITION AND LIQUIDITY
Indicators
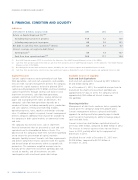
At December 31 ($ millions, except as noted) 2013 2012 2011
Return on Capital Employed (%)(1)(2)
.......................................................................................................................................................................................................................................................
Excluding major projects in progress 11.5 7.2 13.8
.......................................................................................................................................................................................................................................................
Including major projects in progress 9.9 5.8 10.1
Net debt to cash flow from operations(2) (times) 0.7 0.7 0.7
Interest coverage on long-term debt (times)
.......................................................................................................................................................................................................................................................
Earnings basis(3) 9.5 7.9 10.7
.......................................................................................................................................................................................................................................................
Cash flow from operations basis(2)(4) 16.8 17.7 16.4
(1) Non-GAAP financial measure. ROCE is reconciled in the Advisories – Non-GAAP Financial Measures section of this MD&A.
(2) Cash flow from operations and metrics that use cash flow from operations are non-GAAP financial measures. See the Advisories – Non-GAAP Financial
Measures section of this MD&A.
(3) Net earnings plus income taxes and interest expense, divided by the sum of interest expense and capitalized interest on debt.
(4) Cash flow from operations plus current income taxes and interest expense, divided by the sum of interest expense and capitalized interest on debt.
Capital Resources
Available Sources of Liquidity
Suncor’s capital resources consist primarily of cash flow Cash and Cash Equivalents
from operations, cash and cash equivalents, and available Cash and cash equivalents increased by $817 million to
lines of credit. Suncor’s management believes the company $5.202 billion during 2013.
will have the capital resources to fund its planned 2014
capital spending program of $7.8 billion and meet working As at December 31, 2013, the weighted average term to
maturity of the short-term investment portfolio was
capital requirements through existing cash balances and approximately 57 days. In 2013, the company earned
short-term investments, cash flow from operations,
approximately $26 million of interest income on
available committed credit facilities, issuing commercial this portfolio.
paper and issuing long-term notes or debentures. The
company’s cash flow from operations depends on a Financing Activities
number of factors, including commodity prices, production
Management of debt levels continues to be a priority for
and sales volumes, refining and marketing margins, Suncor given the company’s long-term growth plans.
operating expenses, taxes, royalties and foreign exchange
Suncor’s management believes a phased and flexible
rates. If additional capital is required, Suncor’s management approach to existing and future growth projects should
believes adequate additional financing will be available to
assist Suncor in maintaining its ability to manage project
the company in debt capital markets at commercial terms costs and debt levels.
and rates.
Suncor’s interest on debt (before capitalized interest) in
The company has invested excess cash in short-term
2013 was $703 million, compared to $640 million in 2012.
financial instruments that are presented as cash and cash The increase in interest expense relates to new finance
equivalents on the Consolidated Balance Sheets. The
leases in 2013, partially offset by the repayment of
objectives of the company’s short-term investment portfolio debentures in 2013.
are to ensure the preservation of capital, maintain
Unutilized lines of credit at December 31, 2013 were
adequate liquidity to meet Suncor’s cash flow requirements
and deliver competitive returns consistent with the quality $4.536 billion, compared to $4.735 billion at
December 31, 2012.
and diversification of investments within acceptable risk
parameters. The maximum weighted average term to
maturity of the short-term investment portfolio does not
exceed six months, and all investments are with
counterparties with investment grade debt ratings.
56 SUNCOR ENERGY INC. ANNUAL REPORT 2013