Page 29 - Suncor AR English
P. 29
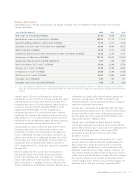
Business Environment

Commodity prices, refining crack spreads and foreign exchange rates are important factors that affect the results of
Suncor’s operations.


Year ended December 31 2013 2012 2011

WTI crude oil at Cushing (US$/bbl) 97.95 94.20 95.10
.......................................................................................................................................................................................................................................................
Dated Brent crude oil at Sullom Voe (US$/bbl) 108.75 111.70 111.15
.......................................................................................................................................................................................................................................................
Dated Brent/Maya FOB price differential (US$/bbl) 11.65 12.15 12.50
.......................................................................................................................................................................................................................................................
Canadian 0.3% par crude oil at Edmonton (Cdn$/bbl) 93.90 86.60 95.75
.......................................................................................................................................................................................................................................................
WCS at Hardisty (US$/bbl) 72.75 73.15 77.95
.......................................................................................................................................................................................................................................................
Light/heavy differential for WTI at Cushing less WCS at Hardisty (US$/bbl) 25.20 21.05 17.15
.......................................................................................................................................................................................................................................................
Condensate at Edmonton (US$/bbl) 101.70 100.75 105.30
.......................................................................................................................................................................................................................................................
Natural gas (Alberta spot) at AECO (Cdn$/mcf) 3.15 2.40 3.65
.......................................................................................................................................................................................................................................................
New York Harbor 3-2-1 crack(1) (US$/bbl) 23.90 32.90 27.00
.......................................................................................................................................................................................................................................................
Chicago 3-2-1 crack(1) (US$/bbl) 21.40 27.40 24.65
.......................................................................................................................................................................................................................................................
Portland 3-2-1 crack(1) (US$/bbl) 24.00 33.40 28.40
.......................................................................................................................................................................................................................................................
Gulf Coast 3-2-1 crack(1) (US$/bbl) 20.55 29.00 24.80
.......................................................................................................................................................................................................................................................
Exchange rate (US$/Cdn$) 0.97 1.00 1.01
.......................................................................................................................................................................................................................................................
Exchange rate (end of period) (US$/Cdn$) 0.94 1.01 0.98

(1) 3-2-1 crack spreads are indicators of the refining margin generated by converting three barrels of WTI into two barrels of gasoline and one barrel of
diesel. The crack spreads presented here generally approximate the regions into which the company sells refined products through retail and wholesale

channels.


Suncor’s sweet SCO price realizations are influenced realizations can also be affected by bitumen quality and
primarily by the price of WTI at Cushing and by the supply spot sales. Average prices for WCS at Hardisty held

and demand of sweet SCO from Western Canada. Price relatively constant in 2013 compared to 2012, resulting in
realizations for sweet SCO were positively impacted by an consistent realizations for bitumen.
increase in the price for WTI to US$97.95/bbl in 2013,
Suncor’s price realizations for production from East Coast
compared to US$94.20/bbl in 2012. Stronger price Canada and International assets are influenced primarily by
realizations for sweet SCO also reflected lower industry
the price for Brent crude. Brent crude pricing decreased
supplies of SCO volumes due to planned maintenance by over the prior year and averaged US$108.75/bbl in 2013,
large producers in the second and third quarters of 2013,
compared to US$111.70/bbl in 2012.
partially offset by strengthening supply, takeaway capacity
constraints and lower refinery demand late in 2013.
Suncor’s price realizations for North America Onshore
natural gas production are primarily referenced to Alberta
Suncor produces a specific grade of sour SCO, the price
spot at AECO. Natural gas is also used in the company’s Oil
realizations for which are influenced by various crude Sands and Refining operations. The average AECO
benchmarks including, but not limited to: Canadian par
benchmark increased to $3.15/mcf in 2013, from
crude at Edmonton and WCS at Hardisty, and which can $2.40/mcf in 2012.
also be affected by prices negotiated for spot sales. Prices
Suncor’s refining margins are influenced by 3-2-1 crack
for Canadian par crude at Edmonton increased while the
average for WCS at Hardisty held relatively constant in spreads, which are industry indicators approximating the
gross margin on a barrel of crude oil that is refined to
2013 compared to 2012, resulting in consistent realizations
for sour SCO.
produce gasoline and distillates, and by light/heavy and
light/sour crude differentials. More complex refineries can
Bitumen production that Suncor does not upgrade is
earn greater margins by processing less expensive, heavier
blended with diluent to facilitate delivery on pipeline crudes. Crack spreads do not necessarily reflect the margins
systems. Net bitumen price realizations are, therefore,
of a specific refinery. Crack spreads are based on current
influenced by both prices for Canadian heavy crude oil crude feedstock prices whereas actual refining margins are
(WCS at Hardisty is a common reference) and prices for
based on first-in, first-out inventory accounting (FIFO),
diluent (Condensate at Edmonton and SCO). Bitumen price


SUNCOR ENERGY INC. ANNUAL REPORT 2013 25