Page 126 - Suncor AR English
P. 126
NOTES TO THE CONSOLIDATED FINANCIAL STATEMENTS
(ii) Discontinued Plans
The following plans were in place prior to August 1, 2009: SunShare 2012 Performance Stock Options, Executive Stock
Options, and Key Contributor Stock Options. For options granted under these plans, they generally have a seven to
ten-year life and vest over periods up to four years.
Cash-Settled Plans
(a) Cash-Settled Stock Option Plans
Stock options that the holder can settle for cash or common shares are accounted for as cash-settled plans.
(i) Suncor Energy Inc. Stock Options with TSARs
Options were granted under this plan between August 1, 2009 and July 31, 2010. Each option included a tandem stock
appreciation right (TSAR). Options granted have a seven-year life and vest annually over a three-year period.
(ii) Legacy Petro-Canada Stock Options with CPAs
This plan was discontinued on August 1, 2009. Options were granted to executives and key employees, and can be
settled in common shares or exchanged for a cash payment alternative (CPA). Options granted have a seven-year life and
vest over periods of up to four years.
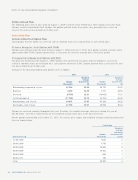
Changes in the total outstanding stock options were as follows:
2013
2012
Weighted Weighted
Average Average
Number Exercise Price Number Exercise Price
(thousands)
($)
(thousands)
($)
Outstanding, beginning of year
47 324
38.33
59 178
35.25
.......................................................................................................................................................................................................................................................
Granted 4 209 32.50 5 101 34.50
.......................................................................................................................................................................................................................................................
Exercised (4 750) 23.31 (10 803) 17.31
.......................................................................................................................................................................................................................................................
Forfeited/expired (11 786) 45.13 (6 152) 42.08
Outstanding, end of year 34 997 37.47 47 324 38.33
Exercisable, end of year
27 104
38.31
29 834
36.23
Options are exercised regularly throughout the year. Therefore, the weighted average share price during the year of
$33.66 (2012 – $31.94) is representative of the weighted average share price at the date of exercise.
For the options outstanding at December 31, 2013, the exercise price ranges and weighted average remaining contractual
lives are shown below:
Outstanding
Weighted
Average
Remaining
Number Contractual Life
Exercise Prices ($)
(thousands)
(years)
1 885
2
11.99-19.99
.......................................................................................................................................................................................................................................................
20.00-29.99 1 793 3
.......................................................................................................................................................................................................................................................
30.00-39.99 16 066 4
.......................................................................................................................................................................................................................................................
40.00-49.99 14 423 3
.......................................................................................................................................................................................................................................................
50.00-59.99 684 1
.......................................................................................................................................................................................................................................................
60.00-72.17 146 1
Total 34 997 3
122 SUNCOR ENERGY INC. ANNUAL REPORT 2013