Page 107 - Suncor AR English
P. 107
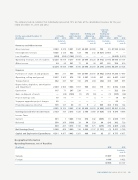
The company had no customer that individually represented 10% or more of the consolidated revenues for the year

ended December 31, 2013 and 2012.


Corporate,
Energy
Exploration Refining and Trading and
For the years ended December 31 Oil Sands and Production
Marketing Eliminations
Total
($ millions)
2013 2012
2013 2012
2013 2012 2013 2012
2013
2012

(restated – (restated – (restated –
(restated –
note 6)
note 6)
note 6)
note 6)
Revenues and Other Income
.......................................................................................................................................................................................................................................................
Gross revenues 9063 8378 5931 5947 26495 26008 109 89 41598 40422
.......................................................................................................................................................................................................................................................
Intersegment revenues 4 026 3 124 432 529 163 212 (4 621) (3 865) — —
.......................................................................................................................................................................................................................................................
Less: Royalties (859) (684) (1 146) (1 631) — — — — (2 005) (2 315)

Operating revenues, net of royalties 12 230 10 818 5 217 4 845 26 658 26 220 (4 512) (3 776) 39 593 38 107
.......................................................................................................................................................................................................................................................
Other income 64 20 381 71 22 38 237 290 704 419

12294 10838 5598 4916 26680 26258 (4275) (3486) 40297 38526

Expenses
.......................................................................................................................................................................................................................................................
Purchases of crude oil and products 460 211 568 444 20 807 20 341 (4 542) (3 949) 17 293 17 047
.......................................................................................................................................................................................................................................................
Operating, selling and general 5 837 5 365 676 795 2 307 2 249 627 488 9 447 8 897
.......................................................................................................................................................................................................................................................
Transportation 482 337 127 182 278 204 (42) (38) 845 685
.......................................................................................................................................................................................................................................................
Depreciation, depletion, amortization
and impairment 2 439 3 964 1 804 1 857 530 464 119 161 4 892 6 446
.......................................................................................................................................................................................................................................................
Exploration 115 71 207 238 — — — — 322 309
.......................................................................................................................................................................................................................................................
Gain on disposal of assets — (29) (130) (1) (7) (13) — (1) (137) (44)
.......................................................................................................................................................................................................................................................
Project start-up costs 15 57 — — — 3 — — 15 60
.......................................................................................................................................................................................................................................................
Voyageur upgrader project charges 82 — — — — — — — 82 —
.......................................................................................................................................................................................................................................................
Financing expenses (income) 135 127 33 81 5 2 989 (68) 1 162 142

9565 10103 3285 3596 23920 23250 (2849) (3407) 33921 33542

Earnings (Loss) before Income Taxes 2 729 735 2 313 1 320 2 760 3 008 (1 426) (79) 6 376 4 984
.......................................................................................................................................................................................................................................................
Income Taxes
.......................................................................................................................................................................................................................................................
Current 331 1 1 443 1 154 674 342 (365) 18 2 083 1 515
.......................................................................................................................................................................................................................................................
Deferred 358 266 (130) 28 64 529
90 (94) 382 729

689
267 (275) (76)
2 465 2 244 1 313 1 182 738 871

468
3 911
2 740
Net Earnings (Loss)
2 040 1 000
138 2 022 2 137
(1 151) (3)

957
6 777
6 957
Capital and Exploration Expenditures
4 311
4
1 483
1 261 890 644
93
95


Geographical Information

Operating Revenues, net of Royalties

2012
($ millions)
2013

(restated –
note 6)

Canada
31 407
.......................................................................................................................................................................................................................................................
30 074

Foreign 8 186 8 033

39 593 38 107


SUNCOR ENERGY INC. ANNUAL REPORT 2013 103