Page 81 - AIF - English
P. 81
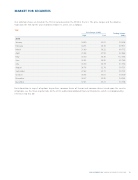
MARKET FOR SECURITIES


Our common shares are listed on the TSX in Canada and on the NYSE in the U.S. The price ranges and the volumes

traded on the TSX for the year ended December 31, 2013, are as follows:


TSX
Price Range (Cdn$)
Trading Volume
(000s)
High
Low
2013
.......................................................................................................................................................................................................................................................
January 34.80 33.01 59 296
.......................................................................................................................................................................................................................................................
February 34.55 30.70 69 971
.......................................................................................................................................................................................................................................................

March 31.99 30.22 68 772
.......................................................................................................................................................................................................................................................

April 31.44 27.50 83 966
.......................................................................................................................................................................................................................................................

May 33.30 30.36 112 344
.......................................................................................................................................................................................................................................................

June 32.02 29.85 85 764
.......................................................................................................................................................................................................................................................

July 33.50 30.79 61 754
.......................................................................................................................................................................................................................................................

August 36.76 32.78 58 751
.......................................................................................................................................................................................................................................................

September 37.63 35.71 58 701
.......................................................................................................................................................................................................................................................

October 38.56 35.61 54 509
.......................................................................................................................................................................................................................................................

November 38.27 35.85 54 542
.......................................................................................................................................................................................................................................................

December 37.81 35.21 53 796


For information in respect of options to purchase common shares of Suncor and common shares issued upon the exercise

of options, see the Share Capital note to the 2013 audited Consolidated Financial Statements, which is incorporated by
reference into this AIF.


SUNCOR ENERGY INC. ANNUAL INFORMATION FORM 2014 79